
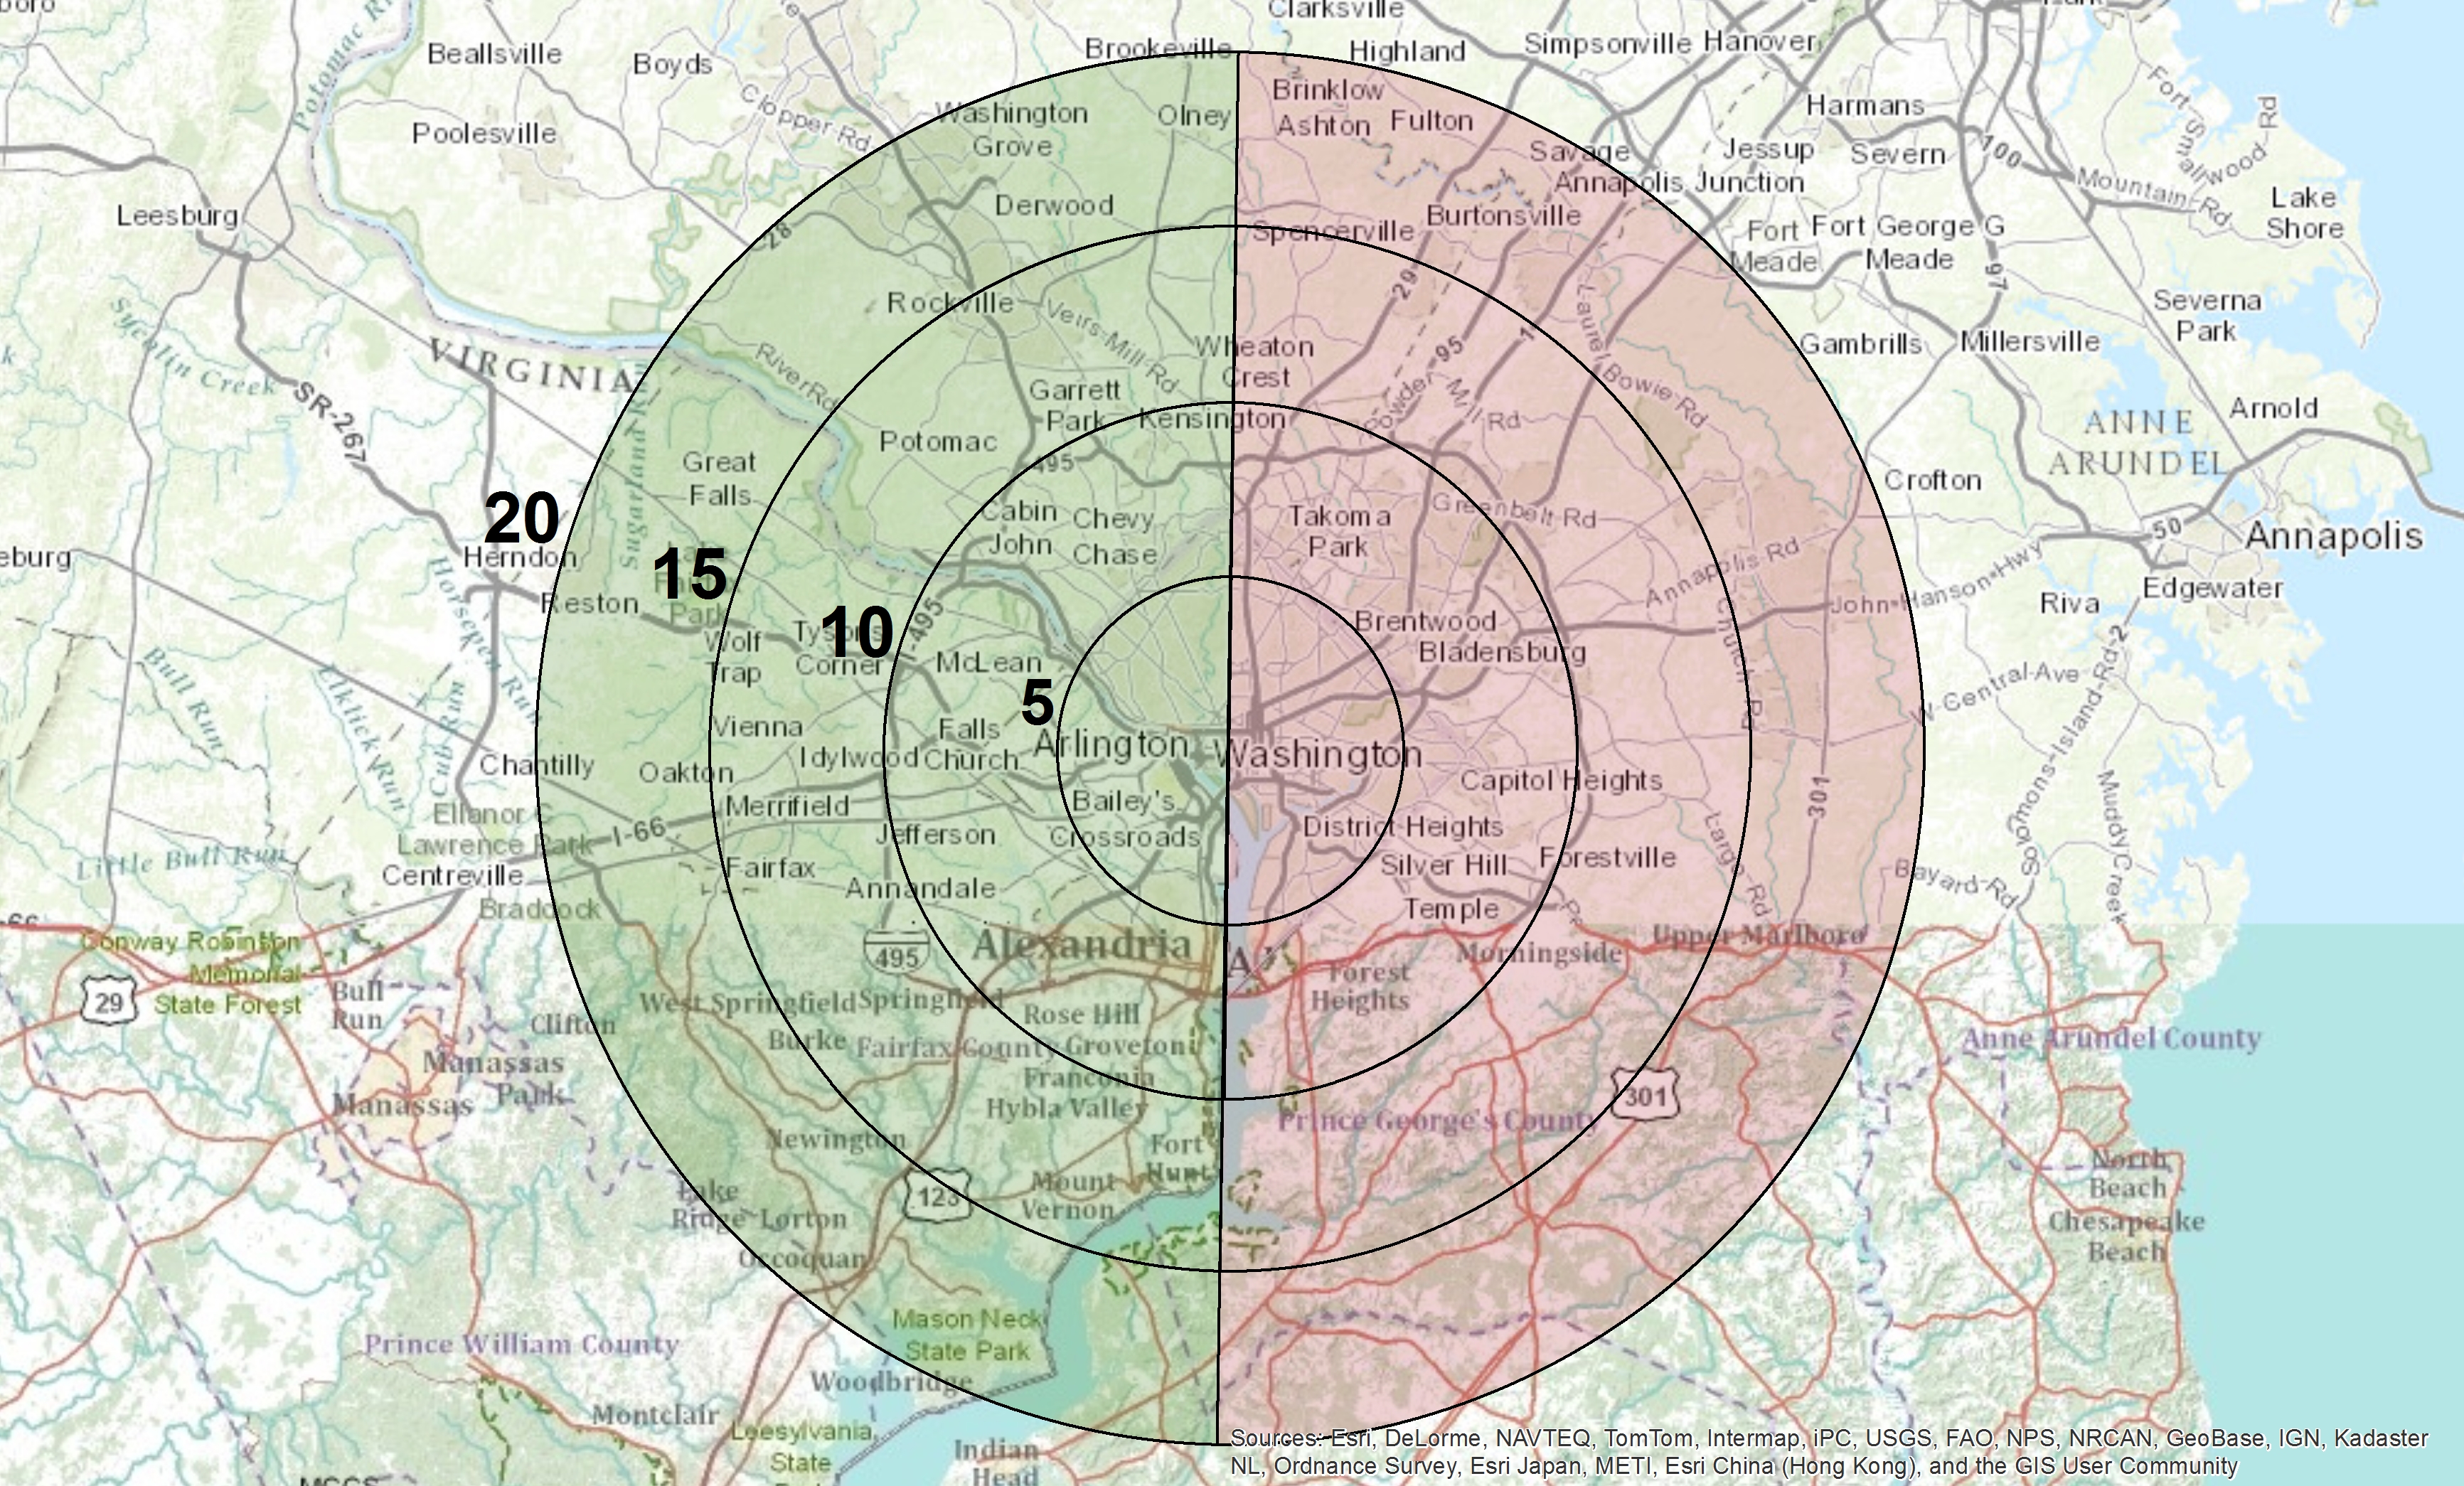
No it’s not a party line. It’s an almost perfectly straight line running north-south along 16th Street, passing through the White House, and then continuing along the Potomac River to the south. It divides two very different sides of the DC area.
These graphs are a cross-section of the DC area that looks at how the city changes as you travel from the center to the periphery. I’ve split the graphs into two sides based on the east-west dividing line. You’ll notice the first one or two miles to the east are much like their western counterparts (this is essentially the area around Capitol Hill and the National Mall). After that, the two sides diverge pretty dramatically.
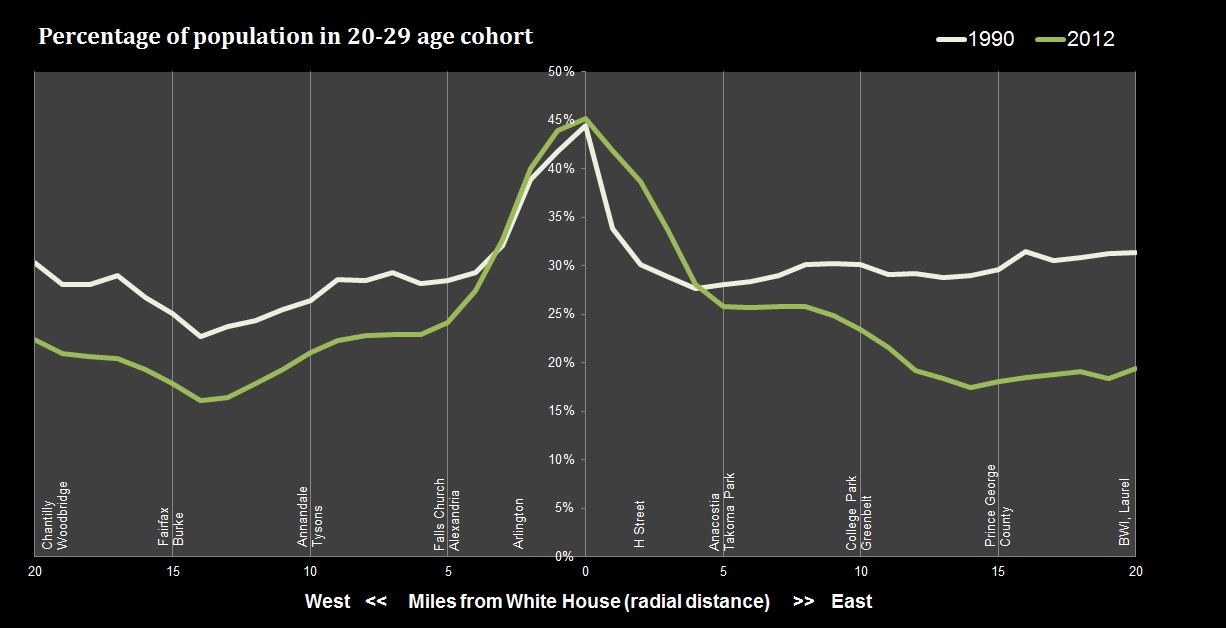
Here are 20-somethings as a percentage of the population. The percentage has fallen slightly throughout the metro area (and throughout the entire country), mostly as a result of the aging population. The exception is downtown. And there has been a significant rise in the area 2-3 miles from the White House on the east side, with residents in their 20’s going from 30% to 40% of the population even as the population continues to get older.
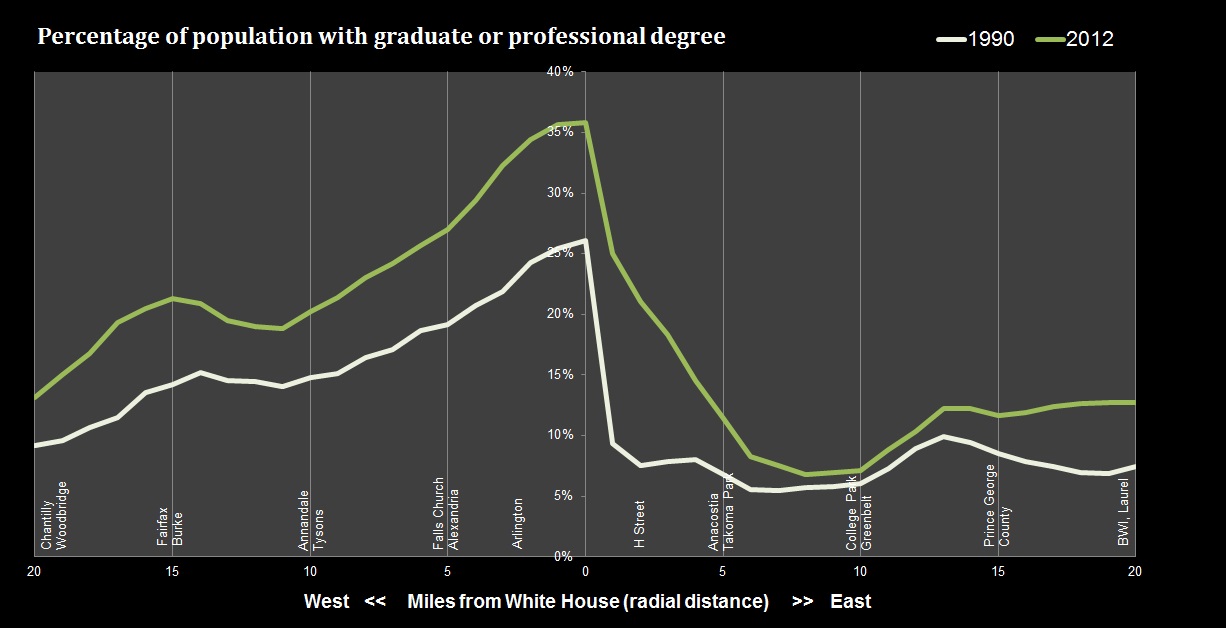
Here are people with graduate and professional degrees. While the number of people with advanced degrees has risen everywhere, there has definitely been a steeper rise in the center.
The income graph looks similar to the education graph. Here, however, the numbers are inflation-adjusted, so they are comparable. Look at how much wealthier the center of the area has become.
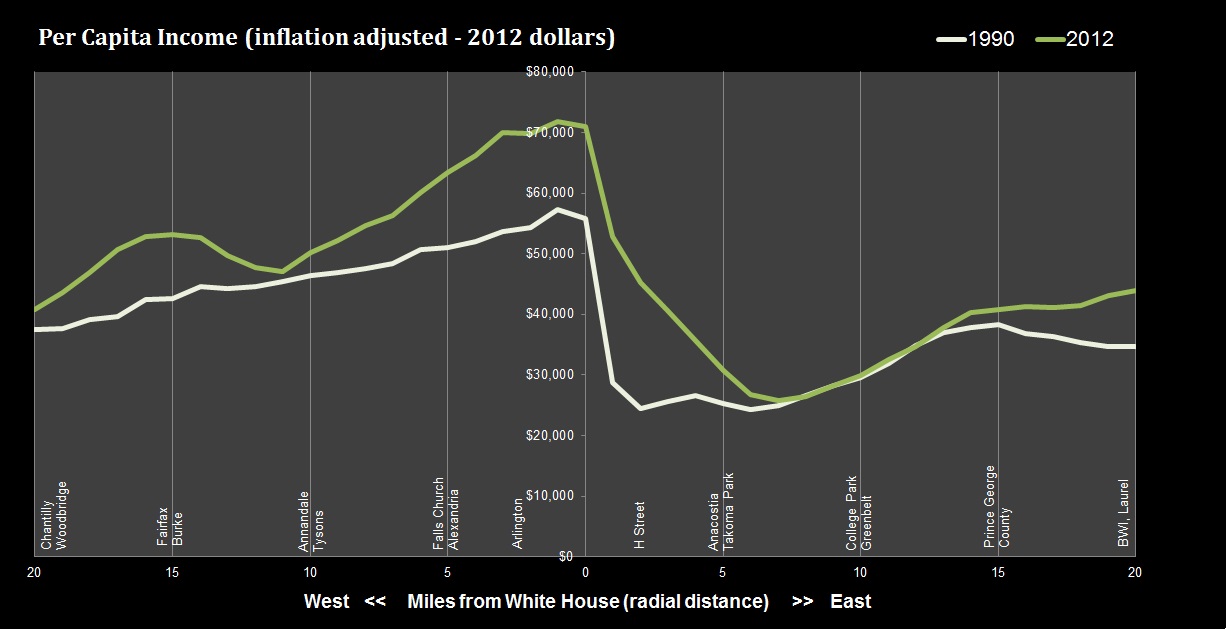
Notice on both graphs that what was a steep cliff on the eastern side in 1990 has become a more gradual drop-off, suggesting that the neighborhoods east of the city center have seen rapid change from lower levels of education and income to higher levels of education and income. This is obvious to anyone who follows real estate trends in the area and has been documented almost ad nauseam by the media.
The east-west gap in education and income level is, sadly, tied to historic racial segregation in the city. The dividing line that these graphs are based on appears starkly on the racial dot map.

Richmond has a similar line, though it splits the city roughly into northwest and southeast and it is not as stark. I’ll do a cross section of Richmond soon.
Data and methodology notes: Data for 1990 comes from the decennial long form census. Data for 2012 comes from the American Community Survey’s 5-year estimates. The data is aggregated at a block group level and then combined for all block groups around the same mile distance. Distance is calculated as the crow flies, not by transportation access (which might be interesting also). The graphs were smoothed out slightly by averaging the data for each mile marker on the graph with its neighbors. For instance, the percentage of degree holders at 5 miles east is the result of combining all the block groups that were between 4 and 6 miles east. This helps to eliminate large anomalies and gives us a better big picture. There are about 30-50 block groups at each mile marker, so there was a sizeable amount of data to draw from.
